Exploring APIs and data structures with Jupyter notebooks
Recently a colleague shared a useful technique for exploring Web APIs with me: Jupyter notebooks.
Previously I used to use Bash scripts and curl for tasks like this. Other colleagues preferred GUI tools like Postman.
Jupyter brings both worlds together:
- You can write code and have access to Python libraries
- You get documentation to share with your colleagues (and your future self)
- GitHub will render Jupyter notebooks as static HTML
- You can include images, tables, and even interactive elements like maps
By the way: This post was written in a Jupyter notebook itself.
Interested? Let’s get started by setting everything up.
The first step is (of course) to install the Jupyter package:
pip install jupyterlab
Note: Depending on when you read this (it was written in early 2020), you might have to check if pip is the Python 3.x version of Python or still the legacy Python 2.7 version. On my machine I had to use the pip3 command that Homebrew created. If that’s the case, the Python executable is most likely also named python3. To make it less confusing, I’ll be using the regular pip and python commands in this post.
Next you can start Jupyter:
python -m jupyterlab
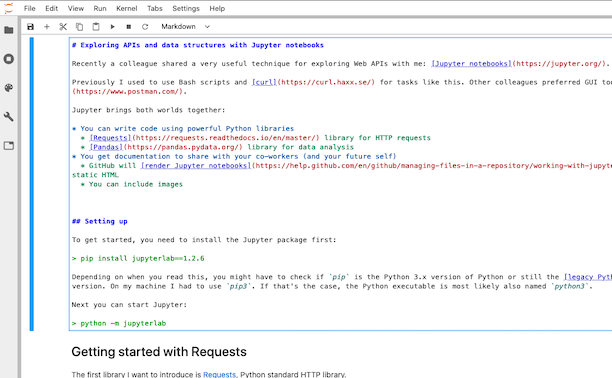
You’ll be greeted with a Web UI like this:
In this post I’ll be using some Python libraries. Here are it’s version number so that you can recognize if your version differ:
import pkg_resources

[pkg_resources.get_distribution(lib) for lib in ['jupyterlab', 'requests', 'curlify', 'pandas', 'nbconvert']]
[jupyterlab 1.2.6 (/usr/local/lib/python3.7/site-packages),
 requests 2.21.0 (/usr/local/lib/python3.7/site-packages),
 curlify 2.2.1 (/usr/local/lib/python3.7/site-packages),
 pandas 1.0.0 (/usr/local/lib/python3.7/site-packages),
 nbconvert 5.6.1 (/usr/local/lib/python3.7/site-packages)]
Getting started with Requests
The first library I want to introduce is Requests, the de facto standard HTTP library for Python.
If you haven’t done so, you should install it using:
pip install requests
Then you are able to load it:
import requests
Let request something simple to try out requests (no pun intended):
response = requests.request('GET', 'http://httpbin.org/json')
response.status_code
200
To get a pretty output from the JSON data, a quick helper function comes in handy:
import json
def pp(item):
    print(json.dumps(item, indent=2))
pp(response.json())
{
  "slideshow": {
    "author": "Yours Truly",
    "date": "date of publication",
    "slides": [
      {
        "title": "Wake up to WonderWidgets!",
        "type": "all"
      },
      {
        "items": [
          "Why <em>WonderWidgets</em> are great",
          "Who <em>buys</em> WonderWidgets"
        ],
        "title": "Overview",
        "type": "all"
      }
    ],
    "title": "Sample Slide Show"
  }
}
If you want to print the response headers, you need to remember that Headers is a CaseInsensitiveDict structure. Wrappingg it in a dict() function enables you to print it using the json.dumps function.
pp(dict(response.headers))
{
  "Date": "Wed, 04 Mar 2020 07:05:33 GMT",
  "Content-Type": "application/json",
  "Content-Length": "429",
  "Connection": "keep-alive",
  "Server": "gunicorn/19.9.0",
  "Access-Control-Allow-Origin": "*",
  "Access-Control-Allow-Credentials": "true"
}
You can get a curl version of your request by using the curlify package:
pip install curlify
import curlify
print(curlify.to_curl(response.request))
curl -X GET -H 'Accept: */*' -H 'Accept-Encoding: gzip, deflate' -H 'Connection: keep-alive' -H 'User-Agent: python-requests/2.21.0' http://httpbin.org/json
Using Pandas to explore JSON documents
Pandas is a data analysis and manipulation library that’s popular in the Data Science community. I find it very useful to explore JSON documents.
Let’s first install the package (you might need to use pip3):
pip install pandas
Now let’s take a look how it would work without pandas:
r = requests.request('GET', 'https://api.github.com/users/janahrens/repos')
json = r.json()
json.__class__
list
We now know that the call returns a JSON list. Let’s examine what items this list has by looking at the first one.
json[0].keys()
dict_keys(['id', 'node_id', 'name', 'full_name', 'private', 'owner', 'html_url', 'description', 'fork', 'url', 'forks_url', 'keys_url', 'collaborators_url', 'teams_url', 'hooks_url', 'issue_events_url', 'events_url', 'assignees_url', 'branches_url', 'tags_url', 'blobs_url', 'git_tags_url', 'git_refs_url', 'trees_url', 'statuses_url', 'languages_url', 'stargazers_url', 'contributors_url', 'subscribers_url', 'subscription_url', 'commits_url', 'git_commits_url', 'comments_url', 'issue_comment_url', 'contents_url', 'compare_url', 'merges_url', 'archive_url', 'downloads_url', 'issues_url', 'pulls_url', 'milestones_url', 'notifications_url', 'labels_url', 'releases_url', 'deployments_url', 'created_at', 'updated_at', 'pushed_at', 'git_url', 'ssh_url', 'clone_url', 'svn_url', 'homepage', 'size', 'stargazers_count', 'watchers_count', 'language', 'has_issues', 'has_projects', 'has_downloads', 'has_wiki', 'has_pages', 'forks_count', 'mirror_url', 'archived', 'disabled', 'open_issues_count', 'license', 'forks', 'open_issues', 'watchers', 'default_branch', 'permissions'])
With the knowledge of available fields, we could now use standard Python methods to further explore the data.
This process gets a lot easier with Pandas and it’s json_normalize function.
With json_normalize the data gets parsed into a DataFrame, which is a core data structure for “Two-dimensional, size-mutable, potentially heterogeneous tabular data”. In other words: It represents the data as a table.
from pandas import json_normalize
df = json_normalize(r.json())
df.shape
(30, 98)
Calling the .shape method is a good first step to explore the data. It shows that our DataFrame/table has 30 rows and 98 columns.
Let’s see what those columns are:
df.columns
Index(['id', 'node_id', 'name', 'full_name', 'private', 'html_url',
       'description', 'fork', 'url', 'forks_url', 'keys_url',
       'collaborators_url', 'teams_url', 'hooks_url', 'issue_events_url',
       'events_url', 'assignees_url', 'branches_url', 'tags_url', 'blobs_url',
       'git_tags_url', 'git_refs_url', 'trees_url', 'statuses_url',
       'languages_url', 'stargazers_url', 'contributors_url',
       'subscribers_url', 'subscription_url', 'commits_url', 'git_commits_url',
       'comments_url', 'issue_comment_url', 'contents_url', 'compare_url',
       'merges_url', 'archive_url', 'downloads_url', 'issues_url', 'pulls_url',
       'milestones_url', 'notifications_url', 'labels_url', 'releases_url',
       'deployments_url', 'created_at', 'updated_at', 'pushed_at', 'git_url',
       'ssh_url', 'clone_url', 'svn_url', 'homepage', 'size',
       'stargazers_count', 'watchers_count', 'language', 'has_issues',
       'has_projects', 'has_downloads', 'has_wiki', 'has_pages', 'forks_count',
       'mirror_url', 'archived', 'disabled', 'open_issues_count', 'license',
       'forks', 'open_issues', 'watchers', 'default_branch', 'owner.login',
       'owner.id', 'owner.node_id', 'owner.avatar_url', 'owner.gravatar_id',
       'owner.url', 'owner.html_url', 'owner.followers_url',
       'owner.following_url', 'owner.gists_url', 'owner.starred_url',
       'owner.subscriptions_url', 'owner.organizations_url', 'owner.repos_url',
       'owner.events_url', 'owner.received_events_url', 'owner.type',
       'owner.site_admin', 'permissions.admin', 'permissions.push',
       'permissions.pull', 'license.key', 'license.name', 'license.spdx_id',
       'license.url', 'license.node_id'],
      dtype='object')
The list of columns itself isn’t a very good demonstration of Pandas analysis capabilities. It gets more useful if we use it’s sorting and filtering capabilities.
Let’s find out what GitHub repositories have the most stars and only select some of the columns:
df.sort_values(by='stargazers_count', ascending=False).head()[['name', 'created_at', 'size', 'language', 'stargazers_count']]
| name | created_at | size | language | stargazers_count | |
|---|---|---|---|---|---|
| 24 | threema-protocol-analysis | 2014-03-16T14:38:56Z | 311 | TeX | 17 |
| 11 | ipconfig-http-server | 2014-05-12T06:15:38Z | 152 | C | 6 |
| 29 | yesod-oauth-demo | 2012-05-15T21:02:29Z | 216 | Haskell | 5 |
| 27 | xing-api-haskell | 2013-01-28T07:28:41Z | 508 | Haskell | 5 |
| 4 | dotfiles | 2011-09-05T09:39:29Z | 2337 | Shell | 5 |
We can also request entries in the table using the .iloc method. The table can be transformed (change rows and columns) with the .T method:
df.iloc[[0]].T
| 0 | |
|---|---|
| id | 207344689 |
| node_id | MDEwOlJlcG9zaXRvcnkyMDczNDQ2ODk= |
| name | alb-fargate-demo |
| full_name | JanAhrens/alb-fargate-demo |
| private | False |
| ... | ... |
| license.key | NaN |
| license.name | NaN |
| license.spdx_id | NaN |
| license.url | NaN |
| license.node_id | NaN |
98 rows × 1 columns
Pandas can do a lot more and it’s definetely worth to take a look at the 10 minutes to pandas guide.
Bonus: Generating a blog post from a Jupyter notebook
My blog gets generated by feeding Markdown files into Jekyll. Using nbconvert I was able to convert this notebook into a Markdown file. The only thing I had to add manually was the header for Jekyll. The rest of this post is directly from the notebook.
First install the nbconvert package
pip install nbconvert
Then you can invoke nbconvert on this file:
python -m nbconvert files/explore-apis.ipynb –to markdown –stdout > _posts/2020-03-02-explore-apis.markdown