The German income tax algorithm
You might have heard it before: The German tax system is complicated. There are a multitude of rules that can be applied. But how complicated is it exactly? And how the heck is my income tax calculated? I recently started to find answers to these questions.
The “Lohnsteuer”, as it’s called in German, used to be calculated with the help of a simple table - the “Lohnsteuer-Tabelle”. You could look up your annual salary to find out how much taxes you had to pay. In 2004 this changed (The German Wikipedia has some details on this - unfortunately only in German).
The interesting thing about it is that the German government decided to replace the table with an algorithm. I think, their intention was quite obvious: Algorithms don’t leave much room for interpretation.
Publishing an algorithm is a good idea, but how exactly do you do this? To start with, you could publish an implementation in a well known language - for example in Java. Java developers would like this. They could simply use this implementation.
However, luckily not everyone uses Java. Having only one implementation in a popular language is problematic for developers that need to use other languages (think about iOS apps). The government agency that published the algorithm could of course release implementations in different languages. This leads to a scalability problem. To name a few: Java, C, Ruby, Erlang, Lua, Go, Scheme, Haskell, JavaScript, VisualBasic, C#, SmallTalk and probably much more. To complicate things, implementing the algorithm isn’t a onetime task. Laws change and with them the algorithm. The solution that was chosen by the German tax office is both, fascinating and shocking: They’re publishing flowcharts.
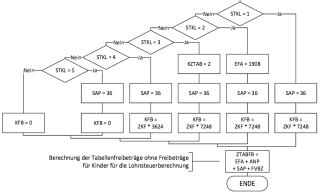
Yup! You heared right. They’re publishing a thirty-something page document that includes a list of input parameters, a list of output parameters and a flowchart.
To be honest: This was the first time I ever saw a flowchart outside of an education context. “Are they really expecting people to implement their algorithm by reading the flowchart?”, I thought. It seems like an error-prone and tedious task: translate thirty pages of flowchart blocks into an implemenation for the language of your choice.
And it’s true: The task is error-prone and tedious. That’s why there’s a table at the end of the flowchart document. Ironically, that table is quite similar to the “Lohnsteuer-Tabelle” that was used before.
Then it got me thinking. Isn’t there a better way to communicate an algorithm in a way that it can be implemented in any programming language? Something like a meta language?
Along with their flowchart document, they published XML files that should achieve exactly that (they call it “XML pseudocode”). In my opinion, they didn’t quite succeed. Although, the file contains elements for abstract concepts, like branches, it still includes expressions that hide in regular text. Those expressions aren’t abstracted from the programming language. It’s quite clear that they were written with Java in mind.
<IF expr="STKL == 4">
  <THEN>
    <EVAL exec="SAP= BigDecimal.valueOf (36)"/>
    <EVAL exec="KFB= (ZKF.multiply (BigDecimal.valueOf (3624))).setScale (0, BigDecimal.ROUND_DOWN)"/>
  </THEN>
  <ELSE> <!-- ... --> </ELSE>
</IF>
In the end, I got curious and started to implement the algorithm straight from the flowchart. I chose Ruby, because there’s no Ruby implementation, yet. Also I’m quite fluent in it. It took me a whole evening to parse and implement the algorithm by following the flowchart boxes. After that I spent an additional evening to find the mistakes I made while implementing it. Maybe it would have been wiser to write a compiler for the XML format.
Nevertheless, I published the results as a Ruby gem: lohnsteuer. I hope this will be helpful for you.
